Market size is one of those pitch deck sections that looks simple until you actually have to build it. Find a large industry number, split it into TAM, SAM, and SOM, put three circles on a slide, and move on.
That may fill the slide, but it does not necessarily make the opportunity more credible.
Investors are not only interested in seeing a large number. They want to understand where that number comes from, which part of the market your company can realistically address, and whether there is a plausible path from your first customer segment to a much larger business.
A strong market slide should therefore do more than say, “This is a $20B market.” It should show the logic behind the opportunity.
What TAM, SAM, and SOM Actually Mean
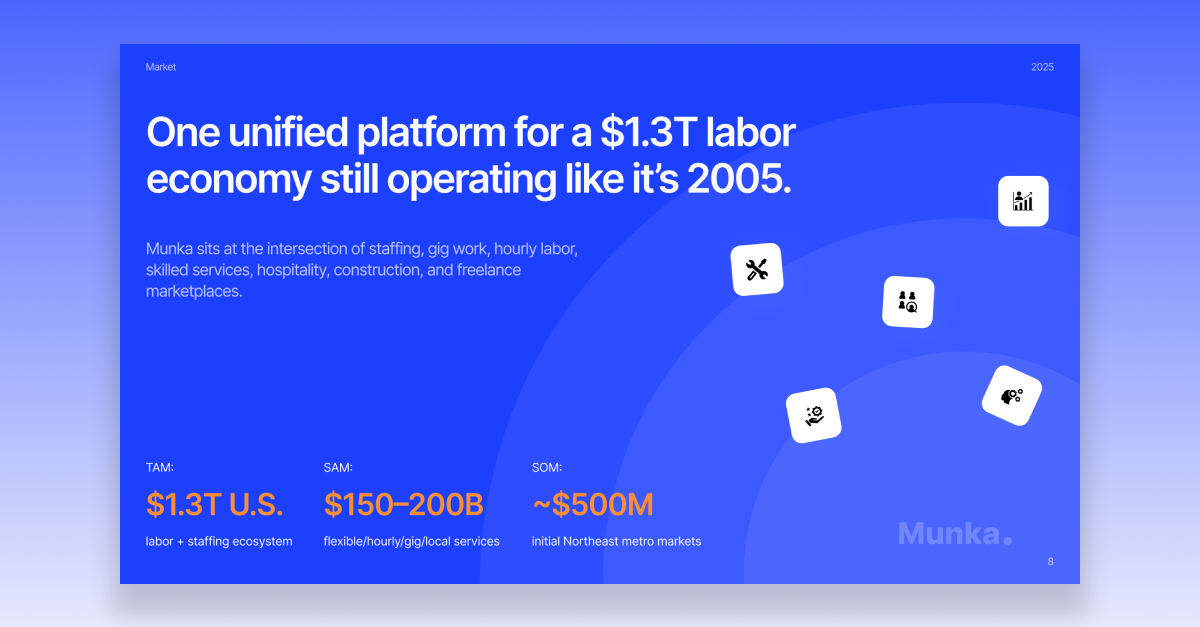
TAM, SAM, and SOM are three ways of looking at the same market at different levels.
TAM - Total Addressable Market represents the broadest possible opportunity. It answers the question: how large could this market be if your product eventually served everyone it could theoretically serve?
SAM - Serviceable Addressable Market narrows that number to the part of the market your product can actually serve based on geography, customer type, use case, product capabilities, or other practical limitations.
SOM - Serviceable Obtainable Market is the most focused layer. It represents the part of that market your company can realistically target based on its current product, positioning, resources, and go-to-market strategy.
The framework is useful because it forces founders to move from a broad industry opportunity toward a realistic starting point. The problem begins when TAM, SAM, and SOM become three large numbers with no visible connection to the actual business.
Why a Huge TAM Is Not Enough
It is easy to make almost any startup look like it operates in a massive market.
A fintech company can point to the global financial services industry. An AI startup can reference the global AI market. A healthcare product can start with total healthcare spending. Those figures might be technically correct, but they tell an investor very little about the opportunity available to that specific company.
Imagine you are building software for mid-sized law firms. Saying that the global legal services market is worth hundreds of billions of dollars provides context, but your product is not going to capture the entire legal industry. A more useful calculation starts with the customers you can actually serve: how many law firms match your target profile, where they are located, what problem they have, and how much they could realistically pay for the product.
That is the difference between presenting a large market and demonstrating that you understand it. Investors should be able to follow where the numbers came from rather than seeing three disconnected figures with TAM, SAM, and SOM labels attached to them.
Top-Down vs. Bottom-Up Market Sizing
There are two common ways to approach market sizing.
A top-down calculation starts with a broad industry figure and narrows it down. You might find research estimating the global HR software market, for example, and then calculate which portion applies to your geography, customer segment, or specific use case. This is useful for showing the broader context, but it can become abstract very quickly.
A bottom-up calculation starts with the customers you can actually sell to.
For example:
40,000 target companies × $12,000 average annual contract value = $480M potential annual market.
Now the logic is visible. An investor can challenge the number of customers or the pricing assumption, but they can also understand exactly how you arrived at $480M.
For many startups, the strongest market section combines both approaches. The top-down view establishes the broader category, while the bottom-up calculation shows how your particular company fits inside it.
Start With Your Customer, Not the Industry Report
One of the easiest ways to make market sizing more credible is to start with the customer profile you are actually targeting. Suppose your startup sells SaaS to accounting firms in the US. Instead of beginning with the global accounting services market, ask:
- How many accounting firms fit our ideal customer profile?
- Which of them experience the problem we solve?
- What could an average customer realistically spend each year?
- Which geography or segment are we targeting first?
- Where can the company expand after that initial market?
These questions connect market size directly to the business model. The same principle applies to consumer startups. The population of an entire country is rarely a useful SOM. What matters is the number of people who actually have the problem, fit the customer profile, can access the product, and are realistically likely to use or pay for it.
The goal is not to produce the biggest possible number. It is to produce a number you can explain.
Your Market Should Be Large - and Growing Fast

For venture investors, market size matters because the company needs enough room to become significantly larger than it is today. But a large market on its own is not always enough. Investors are often looking for categories that are already expanding quickly, with strong double-digit growth providing more room for new companies to enter and scale.
Growth can come from new technology, regulation, changing customer behavior, or shifts in how businesses operate. These changes can create demand that did not exist a few years ago and make the timing particularly attractive for a new company.
This is why a strong market section should answer two questions:
How big can this opportunity become?
How quickly is the market growing, and why now?
A large market shows the potential scale of the opportunity. A fast-growing one helps explain why a new company has a realistic chance to capture a meaningful share of it.
If you are working on the wider investment narrative, our article Pitch Deck Storytelling: Why Decks Fail Before Slide 3 goes deeper into how individual slides need to work together as one argument rather than as isolated pieces of information.
Show the Path From SOM to a Much Larger Opportunity
Founders sometimes make SOM artificially large because they are worried that a focused initial market will look unimpressive. In reality, a realistic starting point can make the expansion story stronger. A startup might initially target US technology companies with 50-200 employees. If that segment works, it could later expand into larger enterprises, other industries, new geographies, or adjacent products.
The story becomes:
a focused entry point today → evidence that the model works → a much larger opportunity tomorrow.
That is usually more convincing than claiming from day one that the company can serve every possible customer in the category. A good pitch deck does not need to pretend the startup already owns a huge market. It needs to make the route toward one believable.
Every Important Number Needs a Source
Market sizing is also one of the easiest places to lose investor confidence. If one part of the deck says there are 200,000 relevant customers and another calculation appears to assume 500,000, even a small discrepancy can make investors question the rest of the financial logic.
Significant claims should therefore be traceable. Depending on the industry, useful sources might include government databases, professional associations, credible market research, public-company reports, regulatory data, or other recognized industry sources.
You also need to distinguish external data from your own assumptions. There is nothing inherently wrong with estimating an average contract value or expected penetration rate in an early-stage company. The important part is making the assumption visible instead of presenting it as an established fact.
A simple rule works well here: if a number materially affects the investment case, you should know where it came from and be able to defend it.
What a Strong Market Slide Might Look Like
There is no requirement to visualize TAM, SAM, and SOM as three circles. For some companies, that format works perfectly well. For others, a bottom-up calculation, customer segmentation, geographic expansion map, or a combination of market size and growth data may communicate the opportunity much more clearly.
A strong market slide might contain:
TAM: the broader category the company could eventually operate in.
SAM: the geographies, segments, or use cases the current product can serve.
SOM: the first market the company is actually building its go-to-market strategy around.
Alongside those numbers, you can show one short calculation explaining where the SOM came from and, when relevant, a data point showing how quickly the category is growing.
The design should make that logic easier to absorb rather than forcing three predetermined circles onto every company. This is something we see repeatedly when working on investor decks at 100PitchDecks: the right visualization depends on what the market argument actually needs to prove.
If you want to see how market sizing fits into a complete early-stage presentation, How to Build a Pitch Deck for a Pre-Seed Round covers the wider structure of the deck.
Common Market Sizing Mistakes
Weak market slides tend to fail in similar ways:
- choosing the largest possible industry instead of the market the product actually serves;
- presenting TAM, SAM, and SOM without showing how they were calculated;
- saying “we only need 1% of the market” instead of explaining a real customer acquisition strategy;
- ignoring market growth and broader changes in the category;
- combining figures from sources that are measuring different things;
- using important numbers without sources;
- making SOM almost as large as TAM despite having a very focused initial product.
None of these problems requires an unnecessarily complex financial model. In most cases, the fix is to get closer to the customer, make the assumptions visible, and ensure that every number connects logically to the business.
Market Size Is Part of the Investment Story
The purpose of TAM, SAM, and SOM is not to prove that your startup exists somewhere inside a huge industry. Investors already know large industries exist. The useful question is whether your company has a believable route into a market large enough to support venture-scale growth.
A strong market section shows where the company starts, how that opportunity was calculated, why the market is attractive now, and where the business can expand if the initial strategy works. When investors can understand that logic without reverse-engineering your numbers, the market slide stops being a formality. It becomes part of the investment case.
If you are building or rebuilding your investor deck and are not sure whether your market story holds up, book a free intro call with 100PitchDecks. We help founders sharpen the investment narrative, structure the right evidence, and turn complex businesses into pitch decks investors can understand quickly.
Artem Pochepetsky is the founder of 100PitchDecks. He has worked on 400+ pitch decks for founders across multiple industries and funding stages, with clients collectively raising more than $250M.